Collecting data with SmartPhones and Citizen Scientists
SmartPhones4Water (S4W) was created with the mission of utilizing mobile technology and citizen science to enrich lives in the developing world by improving our understanding and management of water resources. Collectively, we are passionate about (1) people in the margins and (2) wise stewardship of our natural resources. We believe that water links these themes in a most profound way.
Now all of that sounds really great, but what does it actually mean? On a practical level, what does our attempt to fulfill our mission look like? How do citizen scientists use smartphones to collect the data necessary for wise stewardship of water, one of our most precious natural resources? Great questions! Keep reading for the answers 🙂
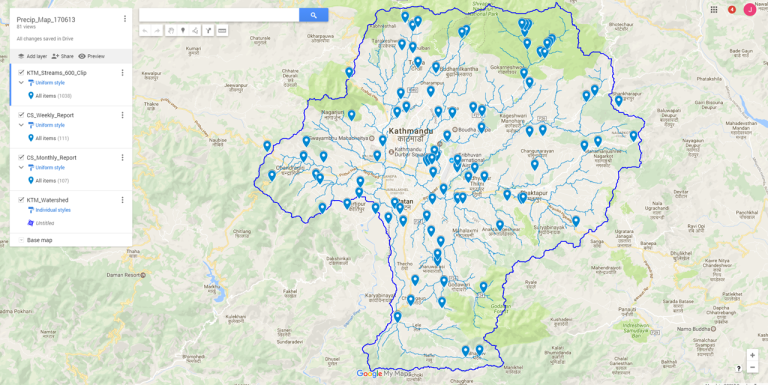
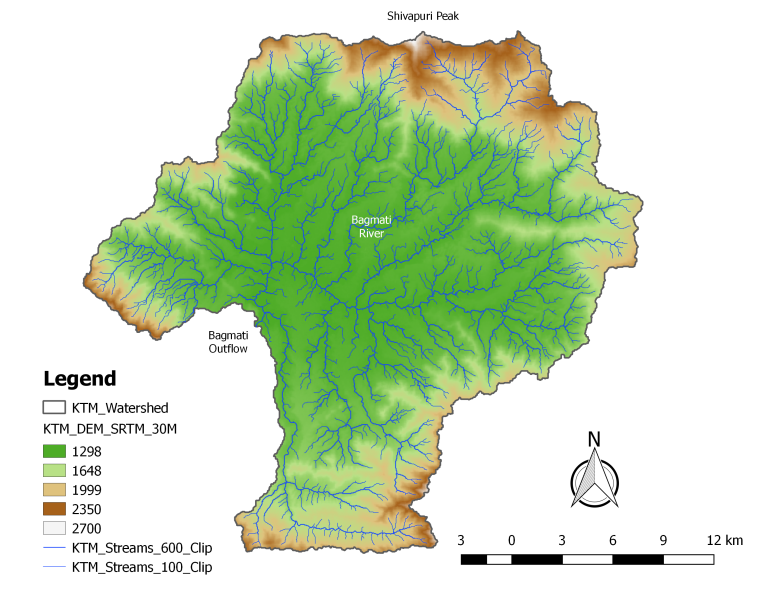
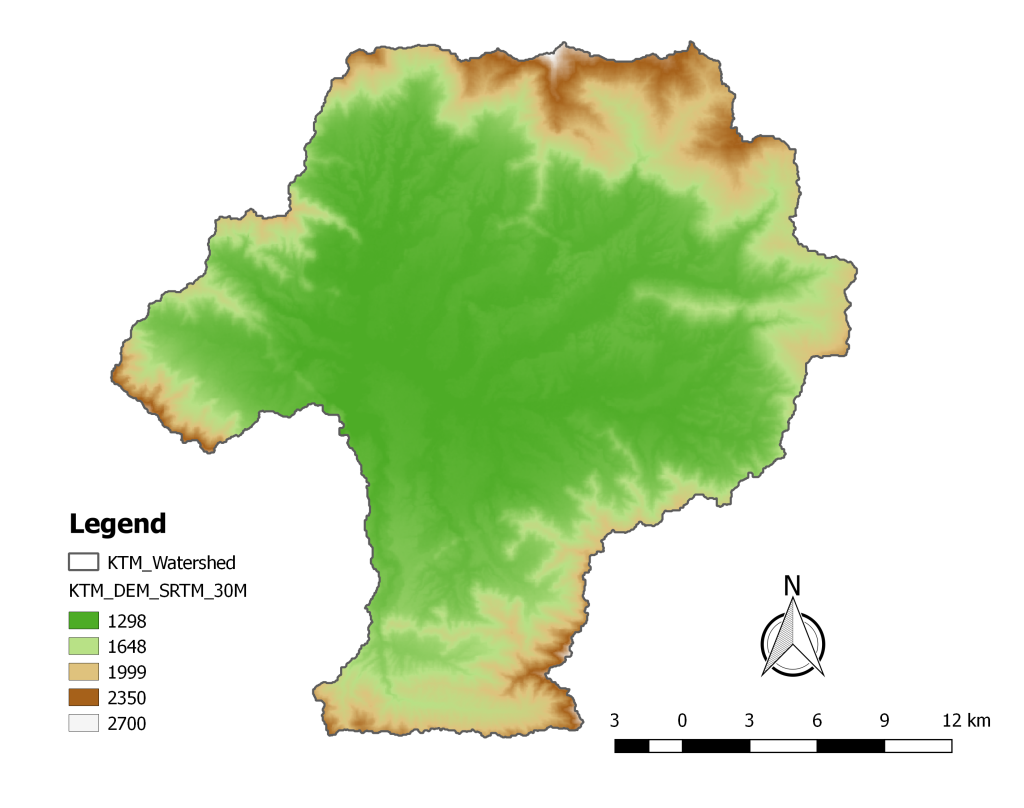
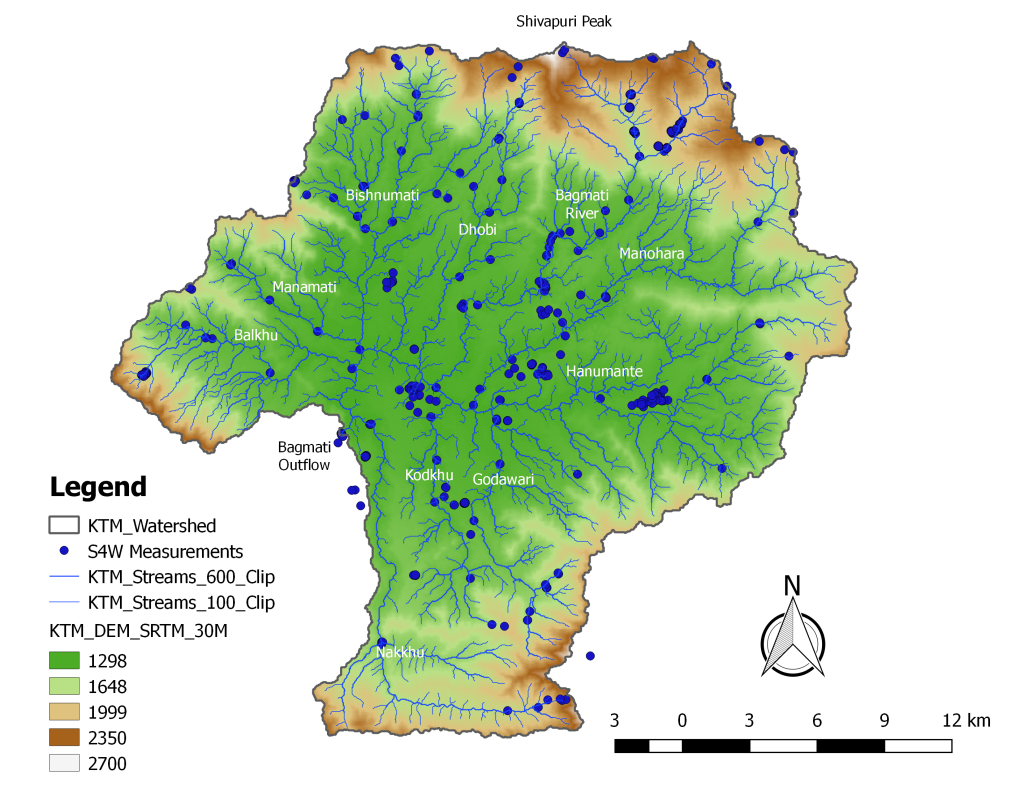
Our first project is focused on the Kathmandu Valley of Nepal (find out more here). Currently, one of our priority goals is to collect precipitation data for the upcoming monsoon season (approximately June through September). All of the available water resources in the Kathmandu Valley originated as precipitation, and for current and continuing management of water resources in the valley, it is critical to understand the location, timing, and quantity of precipitation input to the Kathmandu Valley. If we don’t know where, when, and how much is coming in, we can’t know how much supply is available to be safely and sustainably used to the meet the various water demands in the valley.
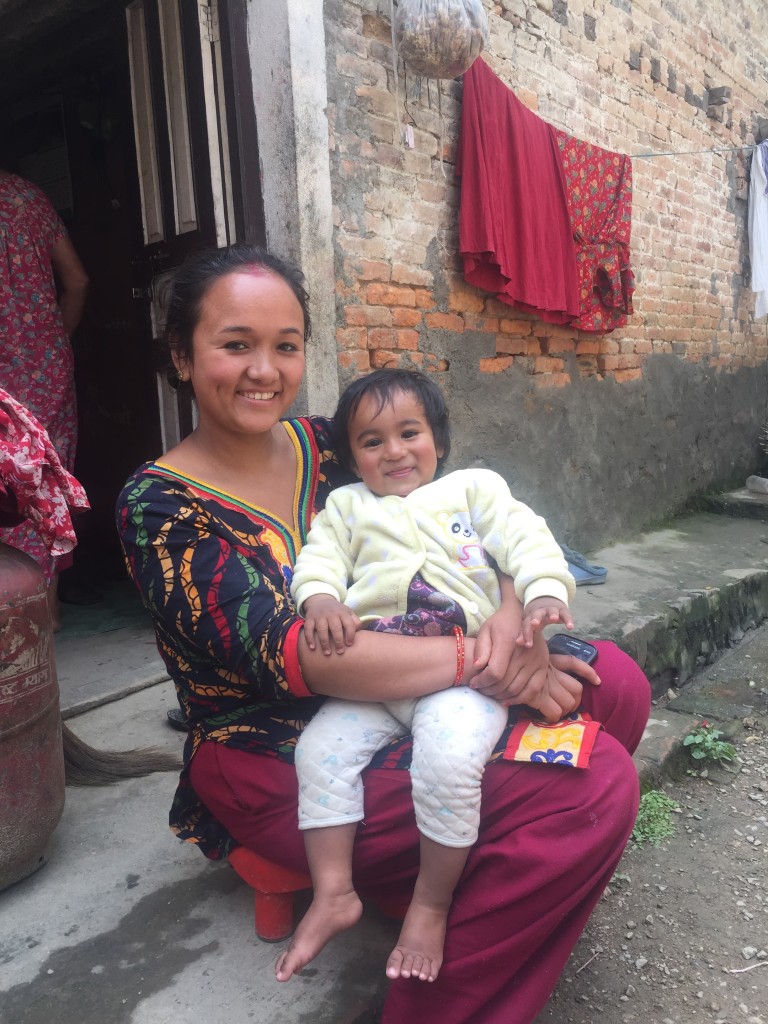
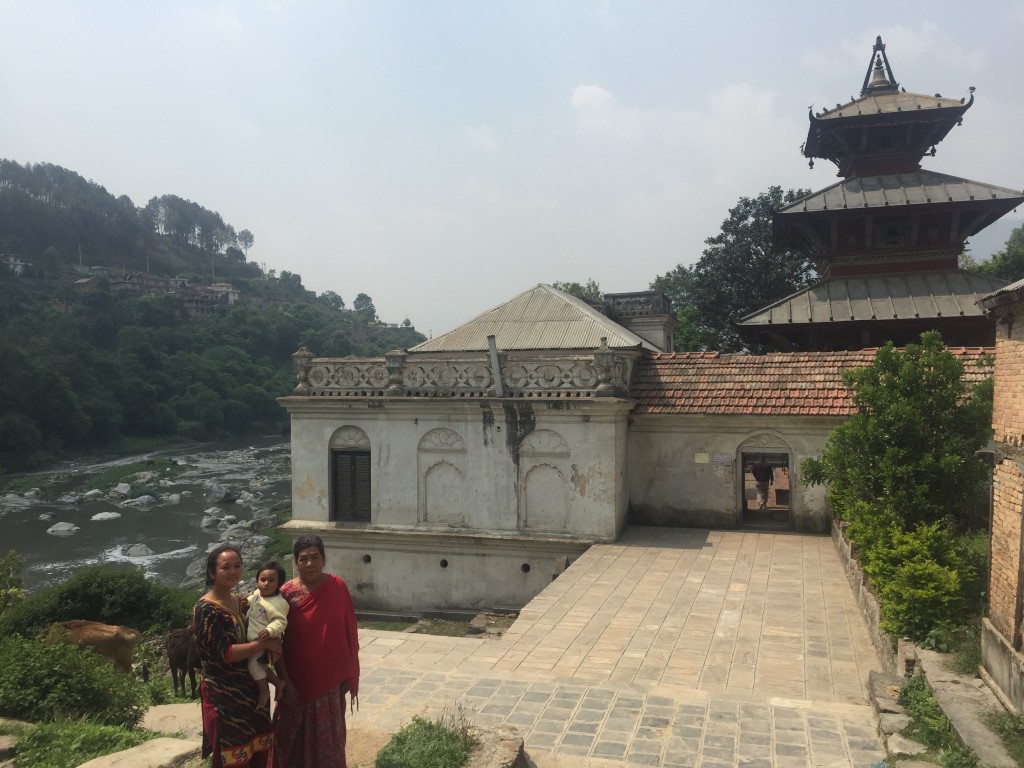
We have a team of staff and citizen scientists scattered across the valley currently at work collecting these important data, and we’ll run you through a typical precipitation measurement as an example of citizen scientist data collection using a SmartPhone. Buckle up! Here we go!
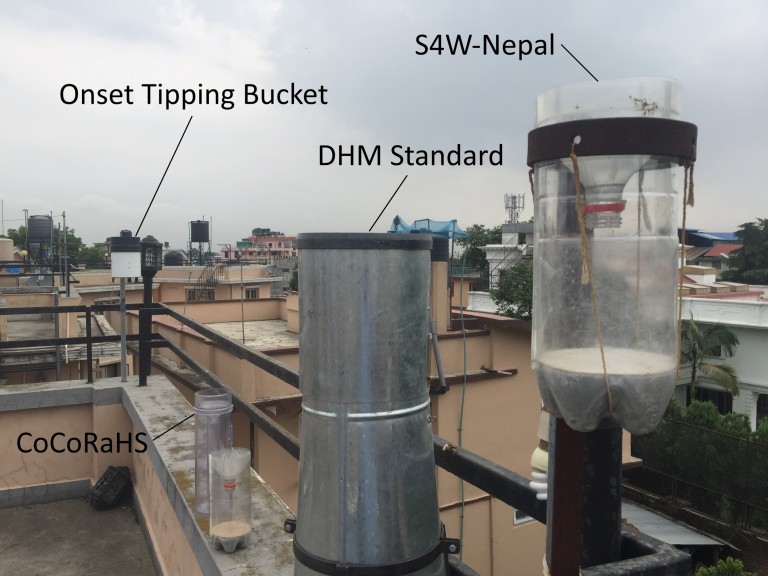
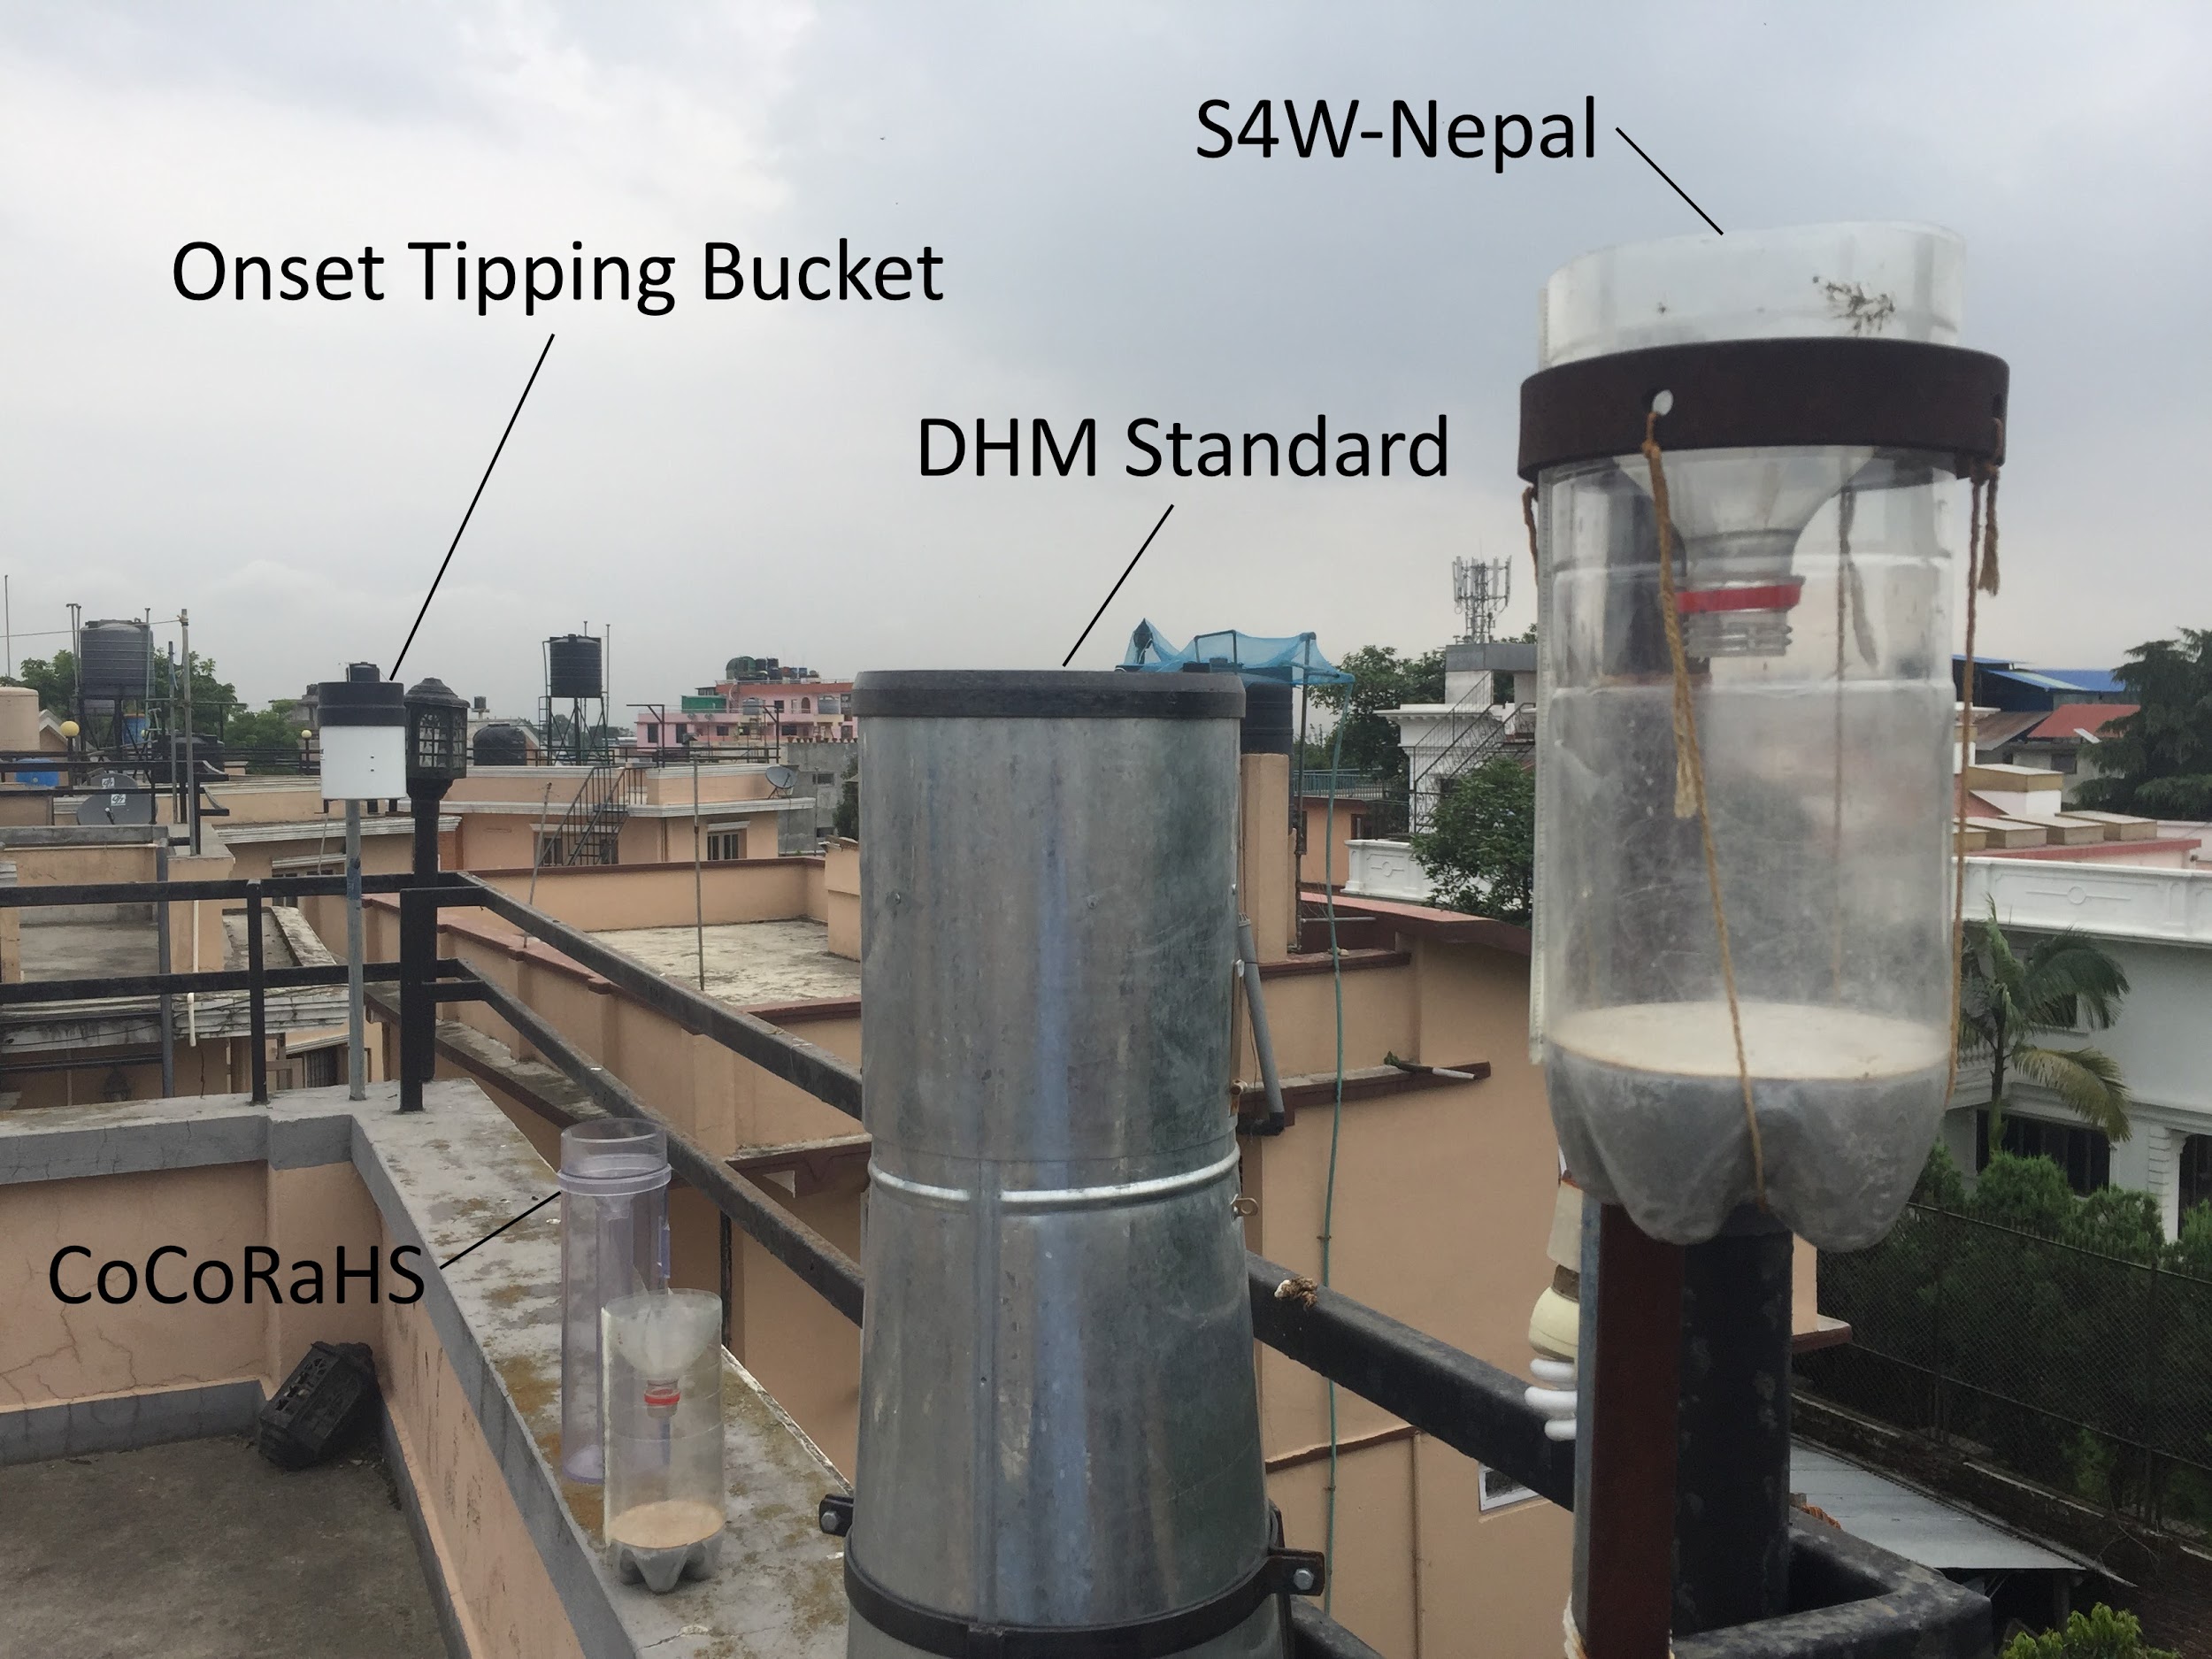
We’ve developed a rain gauge that uses locally available materials and can be constructed for approximately 150 NPR (roughly $1.50). Over the last few months, S4W staff have installed these across the valley to characterize rainfall in different areas. These gauges are maintained and measured by citizen scientists. In one location, three different types of rain gauges are installed alongside our “homemade” gauge as a test of the accuracy and to better understand different measurement methods of precipitation and any biases that may exist. The three other types of gauges are: (1) Onset Hobo tipping bucket rain gauge, (2) Nepal Department of Hydrology and Meteorology standard rain gauge, and (3) CoCoRaHS 4” rain gauge.
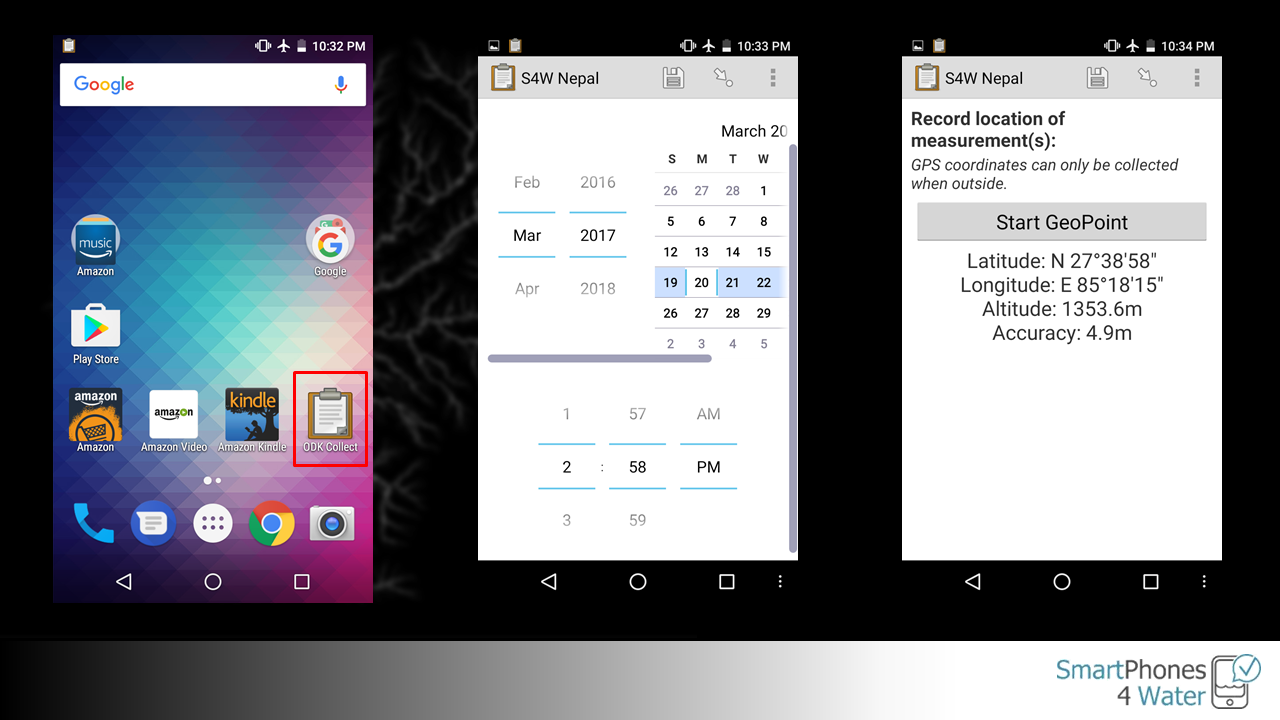
As precipitation occurs, the gauge is filled with water and the amount of precipitation can be manually read off of the gauge. Citizen scientists are encouraged to take daily measurements of precipitation, and they are able to record them on their smartphone using the Open Data Kit (ODK) application and tools, which is a free and open-source technology originally developed with support from Google with the goal of using technology to improve the lives of underserved populations around the world.
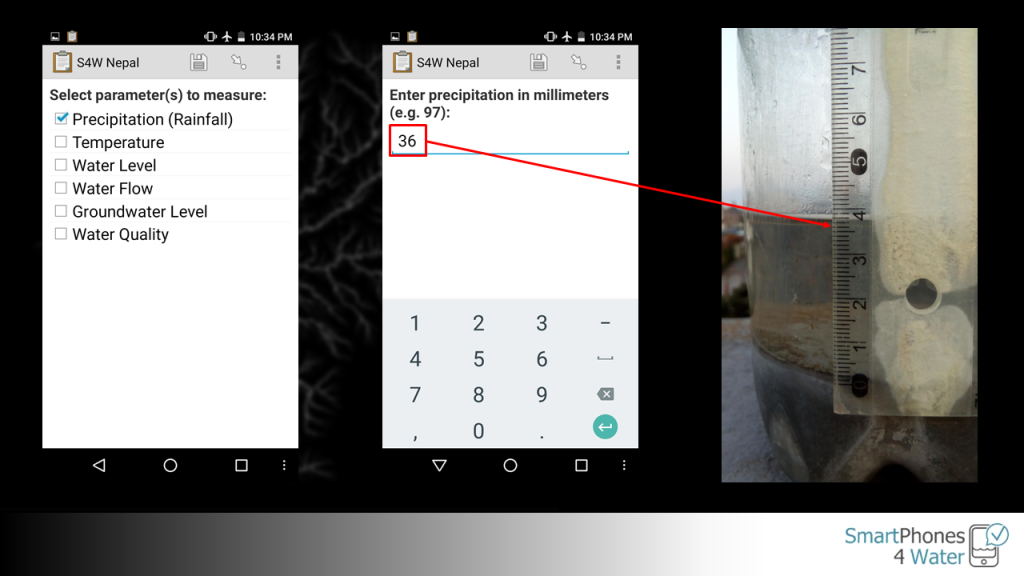
The measurement process in ODK guides users through recording a precipitation measurement in the following step-by-step process:
- Confirming accuracy of SmartPhone’s date and time and recording them as the time of measurement
- Using SmartPhone’s internal GPS to record location (i.e. latitude, longitude, altitude, and accuracy) of measurement
- Selecting the parameter to measure
- Precipitation would be selected for a rain gauge measurement, although the other parameters that S4W is collecting data on include water level, water flow, water temperature, groundwater levels, and water quality.
- Manually entering the precipitation measurement as read from the S4W rain gauge
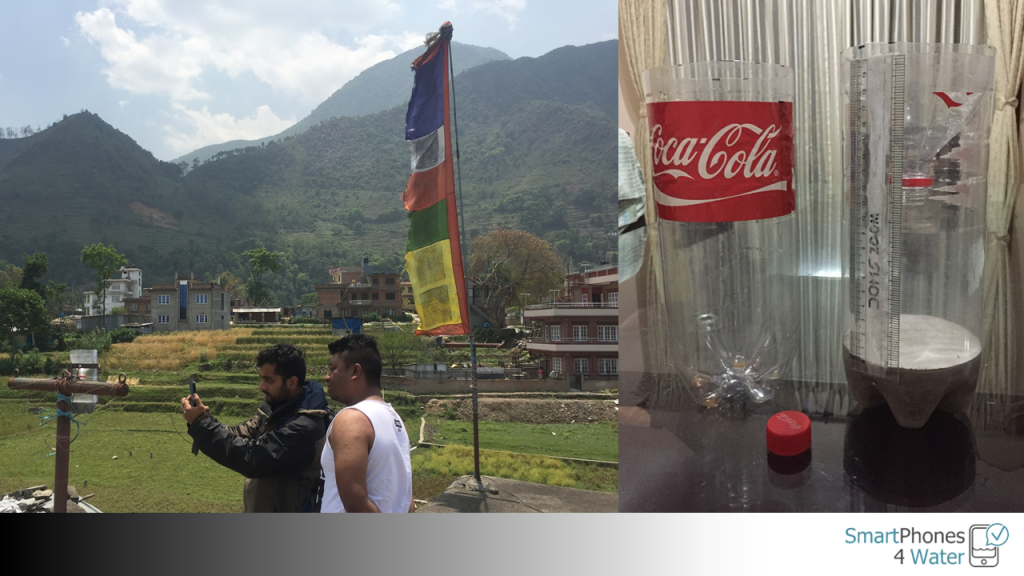
- Taking a photo of the rain gauge and resulting precipitation measurement
- This step is important for QA/QC purposes. All of the measurement are reviewed by a member of the S4W team to confirm that the manually entered value matches what is seen in the photo.
- Entering any comments about the precipitation measurement (optional)
Figure 3 through Figure 5 below visually demonstrate the measurement process through SmartPhone screenshots and a few pictures from the field.

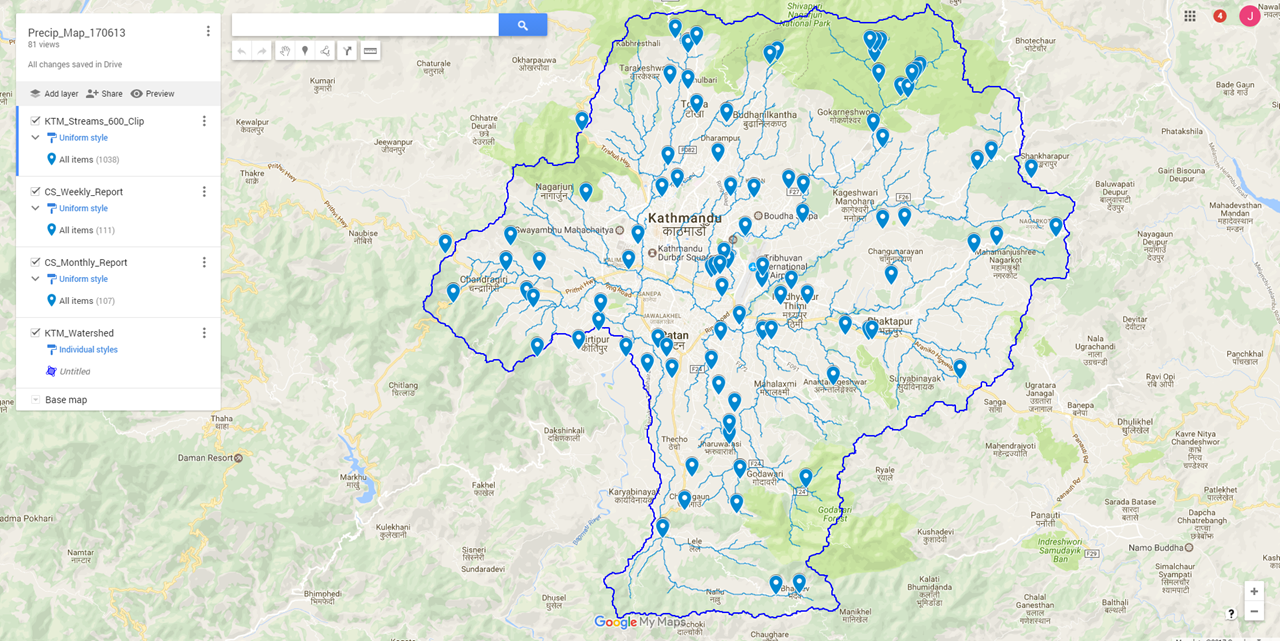
After the measurement has been completed, it is transmitted over the cellular network to a centralized server where it is imported into a ODK Aggregate database. These data are then exported to a custom-built database that has be designed to run automatic QA/QC procedures and organize and summarize the data into a user-friendly format. Through the database, manual QC/QA procedures (e.g. the photo review described above) can be completed, and the data can be processed and organized to determine results over time, which is ultimately what we’re really interested in.
Hopefully that clears up the picture of how citizen science and SmartPhone technology intersect in our best attempt to fulfill our mission of utilizing mobile technology and citizen science to enrich lives in the developing world by improving our understanding and management of water resources.
Check back next month for another story of one of our citizen scientists 🙂
Collecting data with SmartPhones and Citizen Scientists Read More »
