Recruiting Volunteers for 2020 Monsoon Expedition!
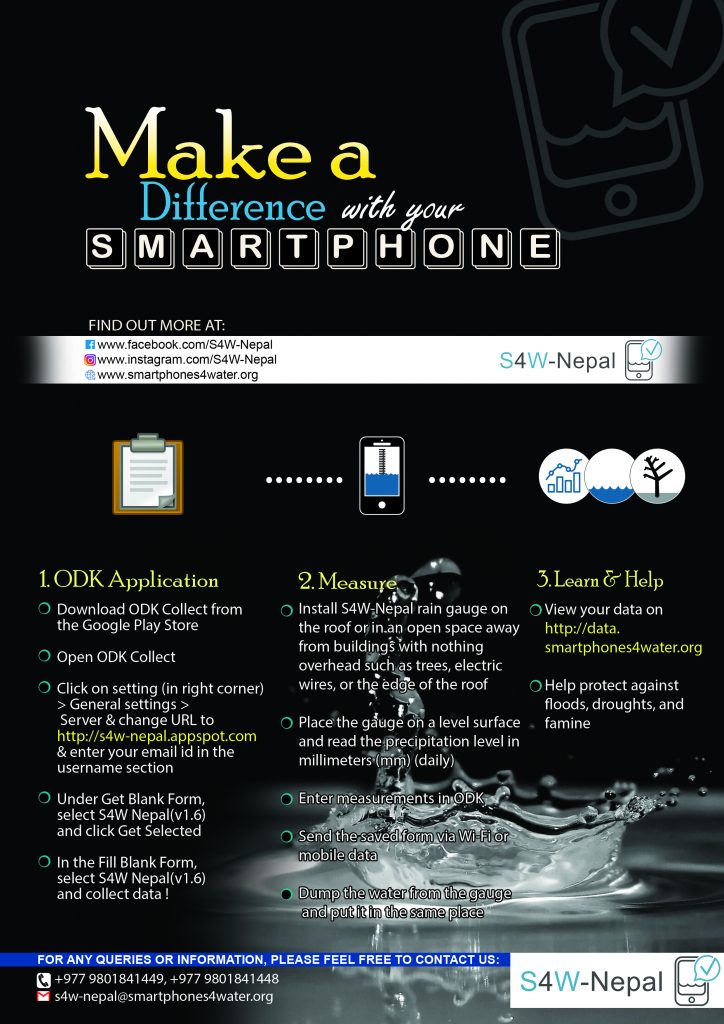
S4W-Nepal is currently recruiting citizen scientists to help them collect precipitation data across Nepal as part of the 2020 monsoon expedition! Participants are asked to collect daily precipitation data during the 2020 monsoon season from June through September! Everything you need to know to participate is included on the poster below, and you can continue reading to find answers to the four questions below:
What is S4W-Nepal’s monsoon expedition?
Why are we doing it?
How will we do it? (i.e. What is our approach?)
Who is (or can be) part of this expedition?
What?
What is S4W-Nepal’s monsoon expedition?
S4W-Nepal’s main objective is to generate good spatio-temporal hydro-meteorological data (e.g. when and where is water moving, how much, and of what quality); these data are necessary to support wise water management decisions. We’ve been doing this for a few years already. During the 2017 and 2018 monsoon, we engaged with over 100 local citizen scientists to measure rainfall in the Kathmandu Valley of Nepal. We attempted to recruit as many citizen scientists as possible and collect as much data as possible. In 2019, we shifted our focus towards data quality rather than quantity. In order to compare the reliability of our data with a standard DHM gauge used to measure precipitation, we placed our stations in places nearby the DHM stations in the Valley.
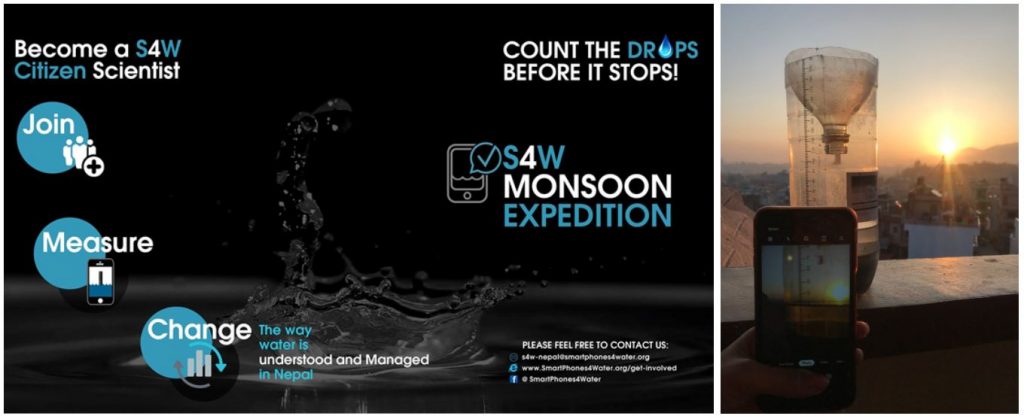
With the same enthusiasm as in the past, S4W-Nepal has launched the Monsoon Expedition 2020 with a slogan “COUNT THE DROPS, BEFORE IT STOPS!”. Through this campaign, we aim to generate consistent, accurate rainfall data and provide the gathered information to all interested stakeholders. In 2020, we are aiming to expand by spreading out of the Kathmandu Valley and characterize the spatial and temporal variability in rainfall patterns for all of Nepal, with a special focus on Kathmandu, Pokhara, Hetauda, Dharan, Biratnagar, and Chitwan. If you live in Nepal, we hope you’ll consider participating.
Why?
Why are we doing it?
Rainfall is an important part of the hydrologic cycle. Precipitation is the source of all of the water that we, as people, and our natural environment and ecosystems need to survive and thrive. Increasing water demand, haphazard urbanization, and poor characterization of the rainfall patterns have hindered effective planning and management practices related to water. Hence, in this regard, what the Kathmandu Valley and other areas of Nepal need most right now is an effective way to characterize these problems and spread the word to the appropriate stakeholders. We need data!
How?
How will we do it?
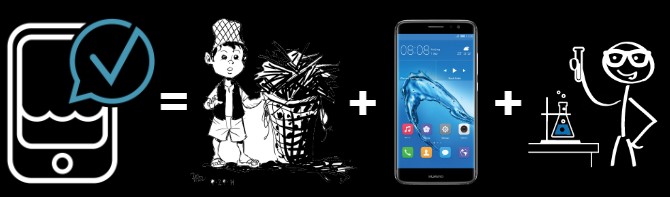
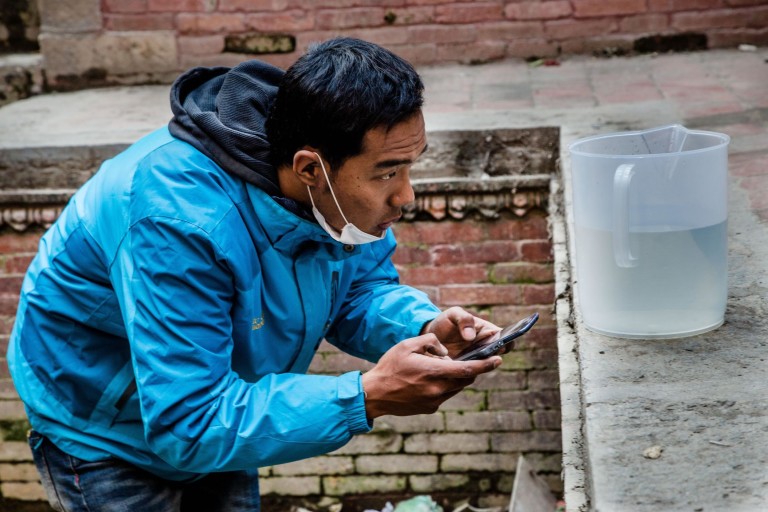
For data generation, S4W-Nepal leverages the power of young researchers, citizen science, and mobile technology. We use an Android smartphone application called Open Data Kit (ODK) Collect to measure precipitation with the help of citizen scientists. Advances in mobile technology through increased GPS accuracy and high-resolution cameras have undoubtedly improved the accuracy and reliability of citizen scientists’ observations. For measuring precipitation, S4W-Nepal uses a local rain gauge constructed of readily available repurposed materials costing less than a dollar and we provide it to citizen scientists for free. This approach is both lower in cost and more rapidly scalable than other traditional methods of measuring precipitation. If you’re wondering how accurate these rain gauges are, we were curious too and completed a peer-reviewed study you can find here.
Who?
Who is (or can be) part of this expedition?
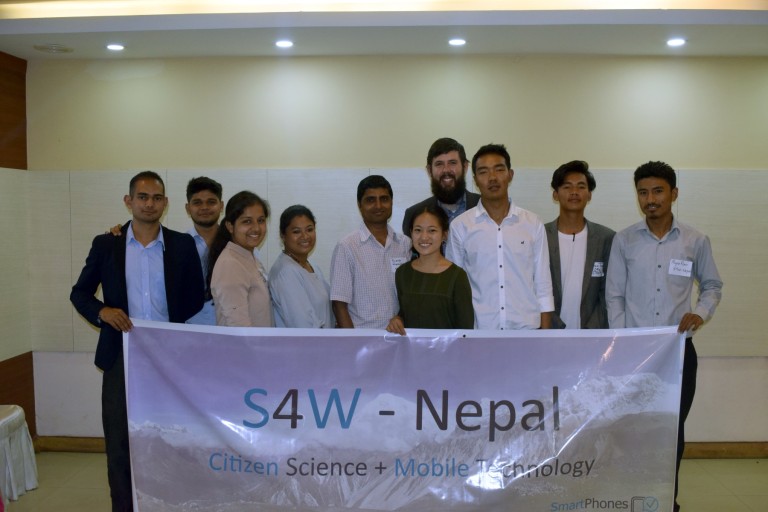
Citizen Scientists! Anyone with an interest in participating, collecting data, learning about their local water resources, and building connections with other like-minded individuals!
It only takes a few minutes each day to record and send in your observations of precipitation and maintain your rain gauge 🙂
Including and involving local citizens in scientific research has the benefit of building the capacity of communities to understand and manage their own water resources, which in turn strengthens their connectedness to place. A deeper connection to the places we call home and to the natural environment and resources, such as water, that we depend on, is something all of us around the world can beneift from. There are no degree or achievement requirements for becoming a citizen scientist; everyone can be one. It is solely driven by personal interest, and we hope you’ll join us!
Contact information for those interested can be found on the poster above 🙂
Recruiting Volunteers for 2020 Monsoon Expedition! Read More »


