Blog
Citizen Science for a Sustainable Mountain Future – MoChWo Symposium Review
As we approach the end of the year, we are looking forward and vision-casting for 2019. However, oftentimes we plan for the future and look ahead by first looking backwards at experiences we’ve had and lessons we’ve learned. As we plan for 2019, we are also reflecting on 2018 and thinking through the experiences that have helped shape us and prepare us for what is to come in the New Year.
In light of this, we have a reflection from Smartphones4Water-Nepal (S4W-Nepal) staff on a conference held in Kathmandu this past October, which was sponsored by SmartPhones4Water. We hope you enjoy it!
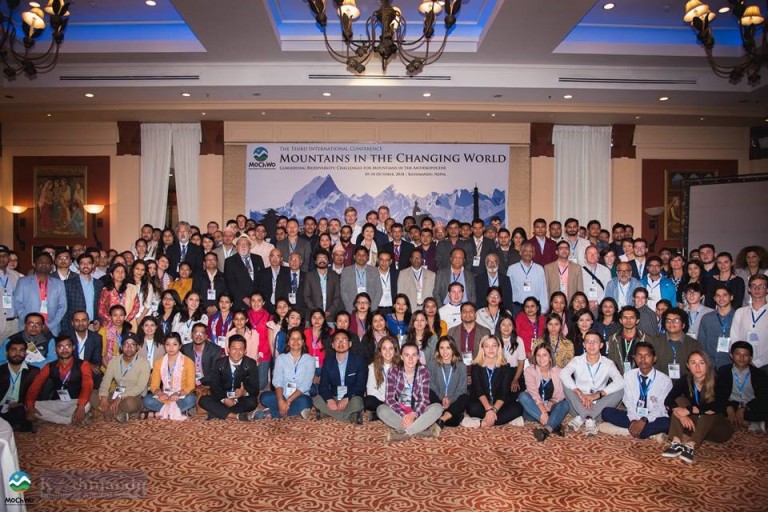
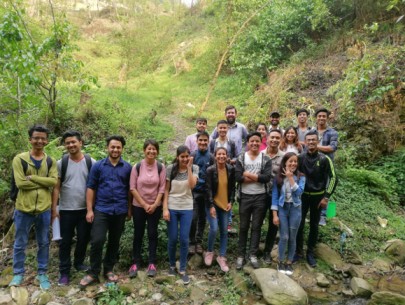
The Kathmandu Institute of Applied Science organized its third conference on ‘Mountains in the Changing World’ (MoChWo) on the 9th and 10th of October 2018 at the Radisson Hotel in Kathmandu. It is an annual event that provides a forum for national/international scholars, researchers, policy makers and students to share research findings and exchange ideas and knowledge covering various aspects of mountain ecosystems. The conference covered broad range of thematic areas such as Disasters: resilience, and adaptation; Biodiversity conservation; Climate change; Environmental pollution; Forest management; Soil, water and atmospheric research; Agriculture and agro-ecology; Sustainable livelihood; and Policies for mountain resources and livelihood. These areas were covered through different symposia, technical sessions and poster presentation sessions. A group photo of MoChWo conference participants can be seen below Figure 1.

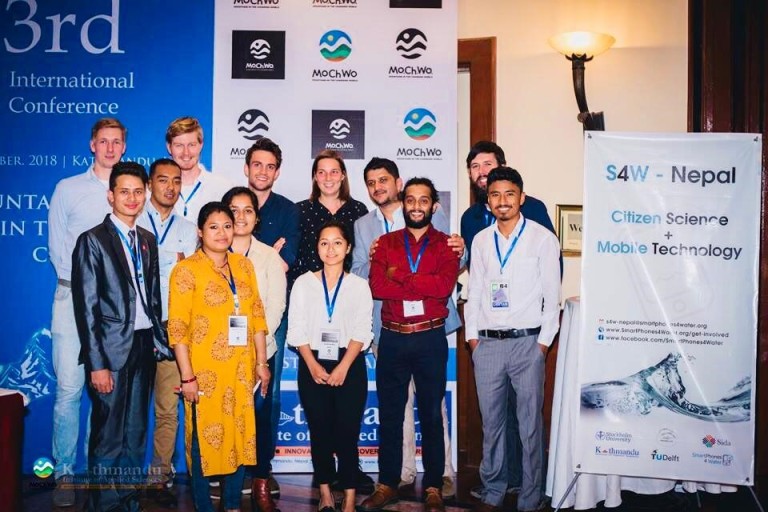
S4W-Nepal organized a symposium titled ‘Citizen Science for a Sustainable Mountain Future.’ Two of the advisors of S4W-Nepal, Dr. Ram Devi Tachamo Shah (Technical Advisor, Himalayan Biodiversity and Climate Center (HimBioCliC)) and Dr. Bhesh Raj Thapa (Researcher-Irrigation Engineer, International Water Management Institute (IWMI) – Nepal), chaired the first and second sessions, respectively. The invited speaker for the first session, Dr. Anjana Shakya (Capacity Building and Higher Education Specialist at PAANI Project and Kathmandu University Visiting Faculty, Environment Education and Sustainable Development), gave a presentation titled“Engaging youth for integrated water resource management in Nepal.” For the second session, Mendel Wong (Co-Founder, Co-Chair and Platform Director of Citizen Science Asia, Hong Kong) gave a talk titled “Building Citizen Science Asia: Community Partnerships and SDGs.” Besides these two presentations, there were 5 other oral presentations and five poster presentations covering citizen science concepts. One of the oral presentations was from some of our colleagues from TU Delft titled “Streams, sewage and shallow groundwater: water quantity and quality interaction in the Kathmandu Valley.” The symposium highlighted the importance of involving citizen scientists in the research field in order to provide researchers with access to a broader array of data, . Participants in the symposium were responsive to the new and cost effective methods of data collection presented and discussed. A photo of S4W-Nepal staff and their TU Delft colleagues taken during the symposium can be seen in Figure 2 below.
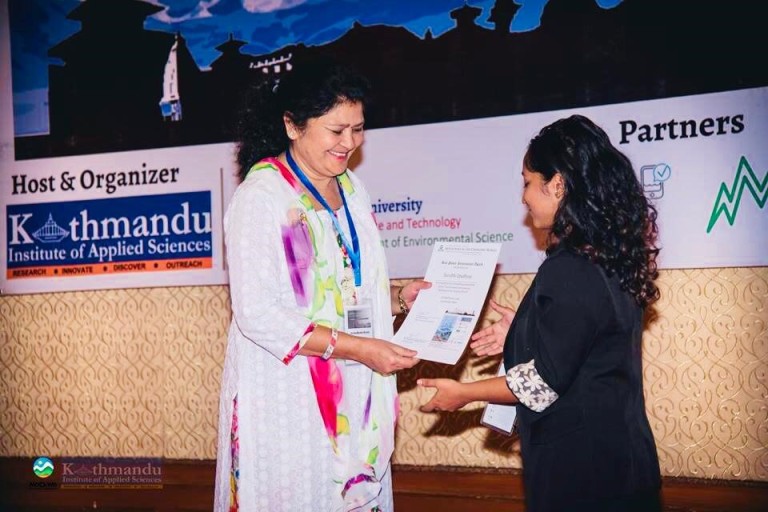
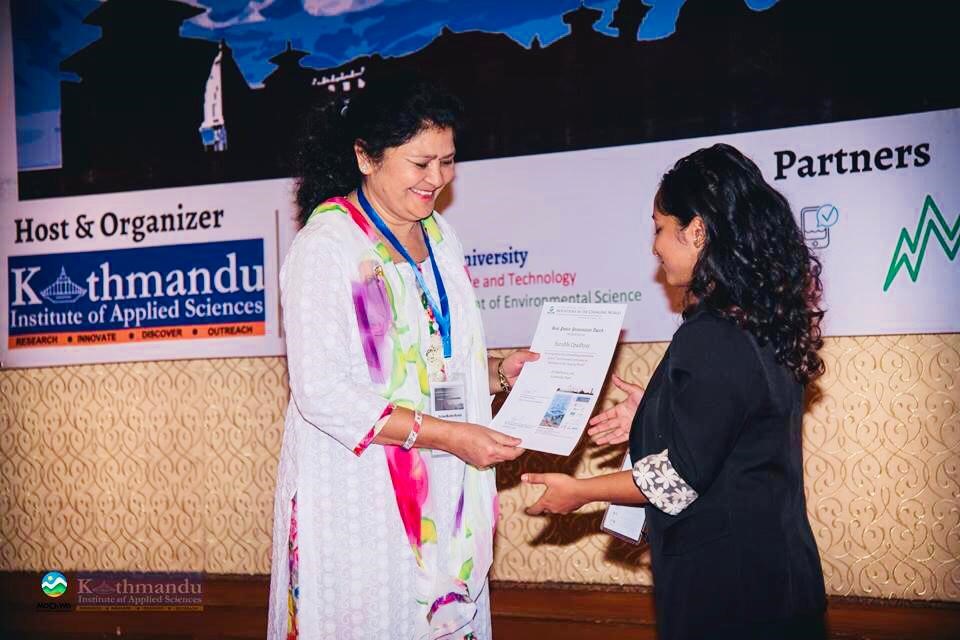
S4W-Nepal provided scholarships to attend the conference to ten qualified candidates based on their research abstracts. Similarly, an award evaluation committee evaluated both the oral presentations and posters presented by students and chose the best four to receive awards. Ms. Surabhi Upadhyay, one of our S4W-Nepal staff members and co-author of this article, won the best undergraduate poster presentation award (Figure 3). Her poster presented research on the importance of involving citizen scientists in generating reliable observations of land use in the Kathmandu Valley.
Overall, the two-day conference was a wonderful platform to share ideas, research findings and projects with people from diverse environmental backgrounds from all across the world. All of us from S4W-Nepal were honored to be a part of the conference and were overwhelmed by the opportunity to share our research work that we’ve invested so much in. We look forward to opportunities in the new year to continue conversations about the importance of science in our world, and we hope to find new platforms and opportunities to share this with others. Thank you for your interest in our work!
By Surabhi Upadhyay and Amber Bahadur Thapa
Post-Script:
We also have a similar reflection on the MoChWo conference from 2017 available here. You can learn more about SmartPhones4Water on our website or by watching a video about our work in Nepal here.
If you’d like to support our work, you can donate used phones and money. 100% of all donations will go directly to supporting ongoing work in Nepal.
Citizen Science for a Sustainable Mountain Future – MoChWo Symposium Review Read More »
Meet Sanjog Lama
Posted on September 24, 2018
Q: What is your name? A: My name is Sanjog Lama.
Q: How old are you? A: I’m 21 years old.
Q: Where were you born? A: I was born in Thankot, Panighat.
Interviewer’s Note: Thankot is a large village to the west of the Kathmandu District in the Bagmati Zone in central Nepal. It lies at the base of Chandragiri Hill, which is a popular tourist destination. A cable car can be taken from Thankot to the top of Chandragiri Hill for excellent views of the surrounding mountains. Thankot is also one of the main entrances into the Kathmandu Valley and the capital from rest of the country, so there are a lot of people traveling to and from Kathmandu that will pass through Thankot.
Q: Where do you live in the Kathmandu Valley? A: I still live in Thankot, Panighat, where I was born.
Q: Can you walk us through a typical day of life? What are the activities you’re doing? A: I have a clothing shop, and I typically spend my days managing the shop and selling clothes.
Q: Can you tell us a little bit about your family (Spouse, Children, Brothers, Sisters, Cousins, etc.)? A: There are 4 members in my family (my father and mother and me and my sister), but currently only three of us live together since my sister got married and lives with her husband. I am the younger child in the family, and my sister is the older.
Q: What is (or was) your favorite subject in school? A: English.
Q: Can you tell us about a favorite memory of yours? A: I do not have that many favorite moments yet, but I really enjoy spending time with friends.
Q: How did you hear about the S4W-Nepal project? A: S4W-Nepal was doing a survey in my area and one of the members of S4W-Nepal team explained to me the concept of citizen scientists collecting precipitation data with smartphones. It caught my interest, and I was intrigued by how I could help in collecting water-related data with just a few clicks and swipes.
Q: What has been your experience as a citizen scientist with S4W so far? A: I am very happy that I am helping S4W-Nepal with precipitation data. Through S4W-Nepal I now know how a regular coke bottle, a little concrete and a ruler can make a difference in data collection.
Interviewer’s Note: You can learn more about how we are able to use smartphones and readily available local materials to collect precipitation data in one of our older stories here. Also, a sneak preview of upcoming events, but we’re working on publishing some of this citizen science-driven precipitation data collection in an upcoming journal. Hopefully we’ll be able to share about that soon!
Sanjog is playing a critical role in S4W-Nepal as a citizen scientist. Each day, Sanjog uses an Android application called Open Data Kit (ODK) to record rainfall collected by an inexpensive locally made rain gauge (each costs about $1.50). Sanjog is motivated to participate in the project because he feels a sense of responsibility to know about the water resources of the valley, and because each observation he makes earns her an extra 25 rupees (roughly $0.25).
S4W-Nepal is a collaboration between S4W, Himalayan Bio-Diversity and Climate Change Center (HimBioCliCC), Kathmandu Institute of Applied Sciences (KIAS), Delft University of Technology, the Swedish International Development Agency, and Stockholm University. Water is our most precious resource. Lord Kelvin, a famous Scottish mathematician, once said, “you can’t manage a resource you don’t measure.” S4W-Nepal’s goal is to generate the data necessary to support wise water management decisions. S4W aims to accomplish this with a three pronged approach of Research, Education, and Employment. This project in the Kathmandu Valley is our first project.
Meet Laxmi Bastola
Posted on July 10, 2018
Q: What is your name? A: My name is Laxmi Bastola.
Q: How old are you? A: I’m 22 years old.
Q: Where were you born? A: I was born in Nagarkot Fedi, Naya Basti.
Interviewer’s Note: Nagarkot Fedi (Naya Basti) is on eastern side of the Kathmandu Valley roughly 5 km west of Nagarkot. Nagarkot is just 26 km east of Kathmandu and is famous as one of the best viewpoints of the Himalayan range (Eight ranges can be seen from west to east: Annapurna, Manaslu, Ganesh, Langtang, Jugal, Rolwaling, Everest and Numbur). Nagarkot was an ancient fort of the Kathmandu Valley built to monitor the activities of other kingdoms. Later, it became a summer retreat area for the royal family before becoming popular as an international hill station (a high elevation refuge from the heat of summer).
Q: Where do you live in the Kathmandu Valley? A: I live in Kharipati, Bhaktapur.
Q: Can you walk us through a typical day of life? What are the activities you’re doing? A: I work as a receptionist in a co-operative bank from 7 am to 10 am, and in the afternoons I am taking beauty parlour training classes.
Q: Can you tell us a little bit about your family (Spouse, Children, Brothers, Sisters, Cousins, etc.)? A: There are five members in my family (my father, mother, sister, brother and me). I am the middle child.
Q: What is (or was) your favorite subject in school? A: Math!
Q: Can you tell us about a favorite memory of yours? A: I don’t have any specific favorite moment, all moments of my life are favorites for me.
Q: How did you hear about the S4W-Nepal project? A: The S4W-Nepal team was having tea after their Rapid Stream Assessment of the Hanumante River (near my house). I met them at that tea shop, and they told me about precipitation measurement and its contribution to improving our understanding and management of water resources. Since then, I have been a part of the S4W-Nepal family.
Q: What has been your experience as a citizen scientist with S4W-Nepal so far? A: It has been fun to learn about something new and to make new friends.
Interviewer’s Note: Laxmi participated in the Pre-Monsoon Workshop hosted by S4W-Nepal prior to start of the monsoon season. S4W-Nepal invited all of their Citizen Scientists to this workshop to create a platform for them to interact and to teach them about the importance of precipitation measurement.
Laxmi is playing a critical role in S4W-Nepal as a citizen scientist. Each day, Laxmi uses an Android application called Open Data Kit (ODK) to record rainfall collected by an inexpensive locally made rain gauge (each costs about $1.50). Laxmi is motivated to participate in the project because she feels a sense of responsibility to help understand and ultimately solve the growing water crisis in the Kathmandu Valley, and because each observation she makes earns her an extra 25 rupees (roughly $0.25).
S4W-Nepal is a collaboration between S4W, Himalayan Bio-Diversity and Climate Center (HimBioCliC), Kathmandu Institute of Applied Sciences (KIAS), Tribhuvan University Institute of Engineering Pulchowk Campus, Delft University of Technology, and the Swedish International Development Agency. Water is our most precious resource. Lord Kelvin, a famous Scottish mathematician, once said, “you can’t manage a resource you don’t measure.” S4W-Nepal’s goal is to generate the data necessary to support wise water management decisions. S4W aims to accomplish this with a three pronged approach of Research, Education, and Employment.
A Report from “Mountains in the Changing World”
Posted on November 25, 2017
For this month’s story, we have a special report from a recent conference held in Kathmandu that SmartPhones4Water had the honor of participating in. It was written by two hard-working and creative young scientists on staff with S4W-Nepal who were able to attend the conference. We hope you enjoy!
George Bernard Shaw once said that if you exchange the same number of apples with someone else, the number of apples you have won’t change. However, if you exchange same number of ideas with someone else, your ideas will double. With the goal of providing a forum for exchanging ideas, research findings, and knowledge related to various aspects of mountains, their unique ecosystems and environment, and how we as humans interact with and affect them, the second international conference on “Mountains in the Changing World” (MoChWo) was held on October 27th and 28th of this year at The Radisson Hotel of Kathmandu in Nepal. It is an annual event organized by the Kathmandu Institute of Applied Sciences (KIAS), and it is attended by many national/international scholars, researchers, policy makers and students. SmartPhones4Water staff and volunteers had the opportunity to attend and participate in this important conference.
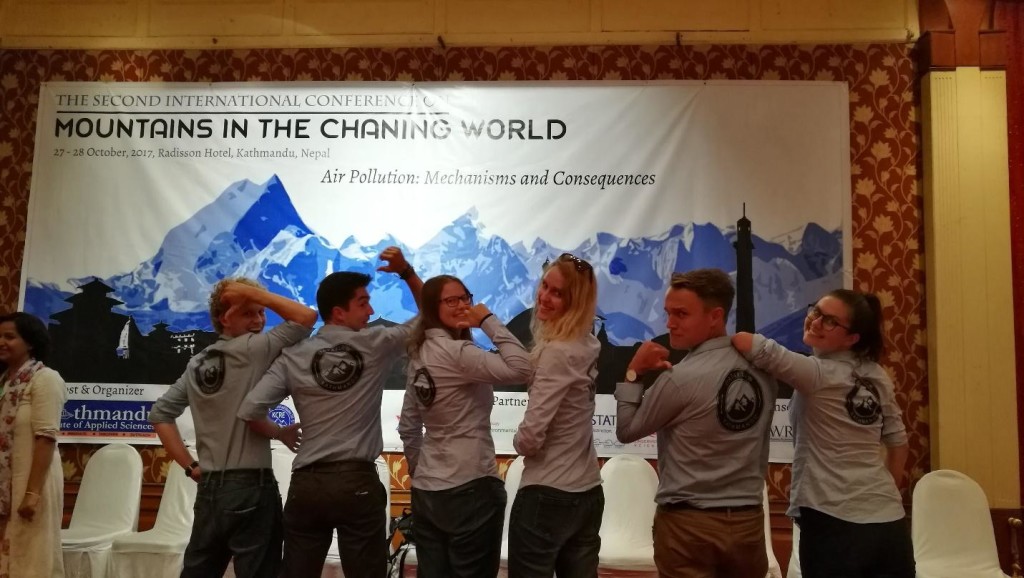
The major theme of MoChWo 2017 was “Air Pollution: Mechanisms and Consequences”. However, it also covered a broad range of other topics including disasters, biodiversity conservation, climate change, environmental pollution, forest management, soil, water and atmospheric research, agriculture and agro-ecology, and sustainable livelihood. The presentation of these topics are covered through four symposiums and a poster presentation session. Smartphones4Water Nepal (S4W-Nepal) was mainly involved in “Citizen Science for a Sustainable Mountain Future” symposium which aimed in understanding the essence of applying citizen science in several topics of research to generate critical environmental data. Another focus of the symposium was on combining citizen science with low cost technologies for implementing citizen science projects in Nepal. One major noteworthy result of this symposium was the establishment of the Citizen Science Association of Nepal (CSAN). This brings all national organizations, researchers, policymakers, and students working with citizen science together under one umbrella.
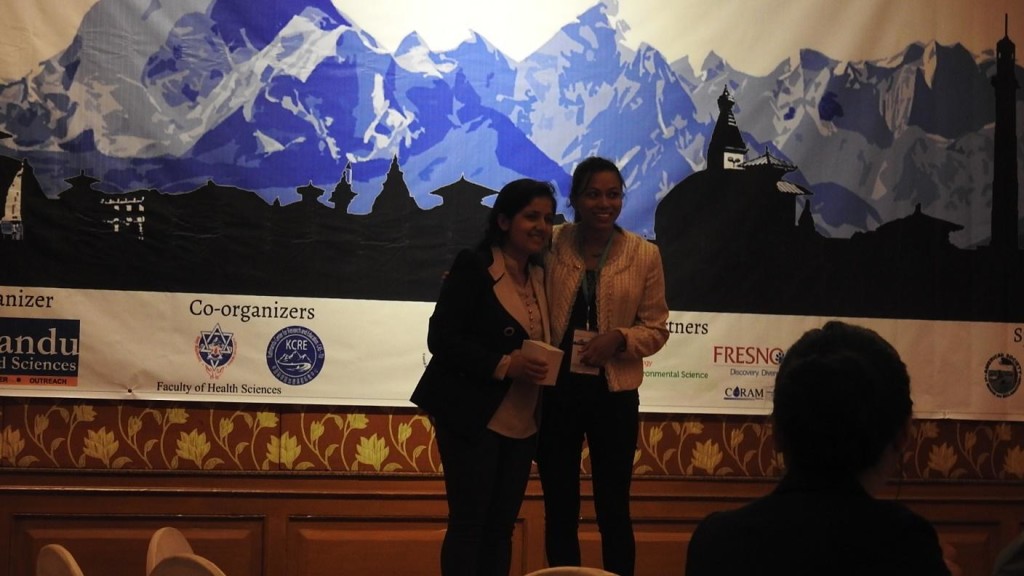
S4W-Nepal provided 17 scholarships to student researchers (which covered either partial or full conference registration fees) through a competitive process based on qualitative evaluation of abstracts the students had written about their research. Similarly, an independent award evaluation committee led by Dr. Rashila Deshar evaluated all oral presentations and posters presented by students. As a result, four best awardees were awarded with certificates and a token of love. Ms. Anusha Pandey, one of our S4W-Nepal staff members, won best undergraduate oral presentation award! 🙂
Her presentation was on the evaluation, identification, and implementation of the most plausible flow measurement technique for citizen science.
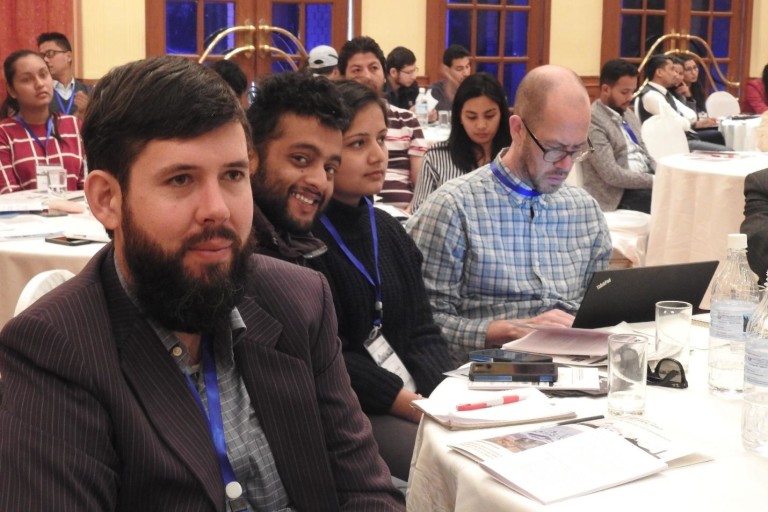
Two members of S4W-Nepal’s advisory board, Dr. Steve Lyon (Professor of Department of Physical Geography from Stockholm University, Sweden), and Dr. Ram Devi Tachamo Shah (Project Coordinator, Aquatic Ecology Centre, School of Science, Kathmandu University), chaired the “Citizen Science” symposium. Dr. Steve gave a presentation about connecting hydrological modelling to stakeholder participation and Dr. Ram Devi on sustainable approaches for biomonitoring of water bodies. Additionally, some of our friends from TU Delft, Netherlands gave a presentation about the influences of land use on the quantity and quality of water sources inside Kathmandu Valley, including a discussion of utilizing citizen science in the future to help collect the data that they collected and used for their study.
Overall, the conference was a very productive two days of a variety of people from diverse backgrounds and interests coming together to discuss ideas, projects, and research in our beloved home country of Nepal. All of us from S4W-Nepal were honored to be a part of the conference and have the chance to bring some of our own apples to share with others, and we’re pleased to report that George Bernard Shaw was right. We left with more apples than we came with.
By Anusha Pandey and Anurag Gyanwali
Meet Pawan Giri
Posted on September 27, 2017
We’re excited to present our third interview with one of our citizen scientists that we have the privilege of working with to collect important data about water resources in the Kathmandu Valley! Hope you enjoy 🙂
Q: What is your name? A: My name is Pawan Giri.
Q: How old are you? A: I’m 21 years old.
Q: Where were you born? A: I was born in Tikabhairab , Lalitpur.
Q: Where do you live in the Kathmandu Valley? A: I live in Tikabhairab, in the Lalitpur District.
Q: Can you walk us through a typical day of life? What are the activities you’re doing? A: I don’t have a job currently, but S4W has provided me with a part time job as a citizen scientist.
Interviewer’s Note: S4W-Nepal is thankful for the opportunity to provide small employment opportunities to people like Pawan in a way that adds value to their lives, improves our understanding of Nepal’s water resources, and thus benefits society in general.
Q: Can you tell us a little bit about your family? A: I have one sibling, a younger sister. I live with my father, mother, and her.
Q: What is (or was) your favorite subject in school? A: Nepali is my favorite subject.
Q: Can you tell us about a favorite moments of yours? A: My favorite moments of my life are from when I was in school.
Q: How did you hear about the S4W-Nepal project? A: I met some members of the S4W team while they were completing a flow measurement in the Nakkhu River near my house. They described the project to me, and when I learned that there was an opportunity to participate, I eagerly joined the movement as a citizen scientist.
Interviewer’s Note: Within the Kathmandu Valley, the Nakkhu River is one of most “pristine” watersheds remaining. Population in the lower watershed is growing quickly and agricultural diversions have greatly increased in the last 10 to 20 years. Many locals recall the times when they used to swim and fish in the Nakkhu River at the Nakkhu Pul (i.e. bridge) upstream of the confluence with the Bagmati river, even in the dry season. Now, the river is essentially dry for several months of the year.
Q: What has been your experience as a citizen scientist with S4W so far? A: It has been fun to learn about water resources. I have been involved in this project as a citizen scientist and it’s been a great experience for me. I am collecting precipitation, water level, and water quality data. I believe preserving groundwater for the future is important.
Pawan is playing a critical role in S4W-Nepal as a citizen scientist. Each day, Pawan uses an Android application called Open Data Kit (ODK) to record rainfall collected by an inexpensive locally made rain gauge (each costs about $1.50) and to record water level as seen on a gauge installed in the Nakhhu River near his house. Pawan is motivated to participate in the project because he feels a sense of responsibility and because he can earn an extra 65 rupees (roughly $0.65) every day through recording observations of precipitation, water level, and water quality (25 rupees are awarded for every precipitation measurements and 40 rupees for water level, temperature, and electrical conductivity (EC) measurements).
S4W-Nepal is a collaboration between S4W-USA, Himalayan Bio-Diversity and Climate Change Center (HimBioCliCC), Tribhuvan University Institute of Engineering (TU IoE), Kathmandu Institute of Applied Sciences (KIAS), Delft University of Technology, the Swedish International Development Agency, and Stockholm University. Water is our most precious resource. Lord Kelvin, a famous Scottish mathematician, once said, “you can’t manage a resource you don’t measure.” S4W-Nepal’s goal is to generate the data necessary to support wise water management decisions. S4W aims to accomplish this with a three pronged approach of Research, Education, and Employment. This project in the Kathmandu Valley is our first project.
Data Making a Difference – Flow Measurement at Stone Spouts
The overall objective of SmartPhones4Water’s work in the Kathmandu Valley is to assist with generating the data required to guide water management decisions and allow for wise stewardship of water resources, and it has a rather long time scale associated with it. You need continuous data over an extensive period of time to understand how available water supplies are changing and to pick up on trends and respond accordingly. For example, in the United States, many of the data records regarding stage and flow in streams and rivers, and water levels in groundwater wells, go back around a hundred years into the early 20th century. This lengthy data record allows water managers and policy makers to better understand how factors such as increasing urbanization, changes in agricultural practices and land use, and climate change affect water resources. We are just beginning to generate and collect these data in the Kathmandu Valley in Nepal with all of our local project partners, but we know that over time, as the length of the data records grow, the value of the data records grow as well.
However, after that lengthy aside as an introduction, this month’s story is about how the data we are collecting can also be immediately useful and positively impact the lives of people. There may be some additional follow-up stories on this same topic (as there is a lot to explore and a lot to say), but this will serve as an introduction to the flow measurement data we are collecting at stone spouts scattered across the Kathmandu Valley.
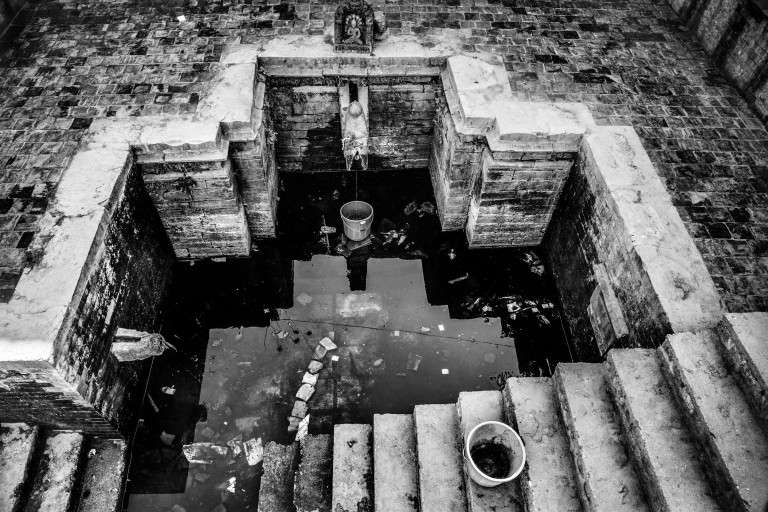
Stone Spouts
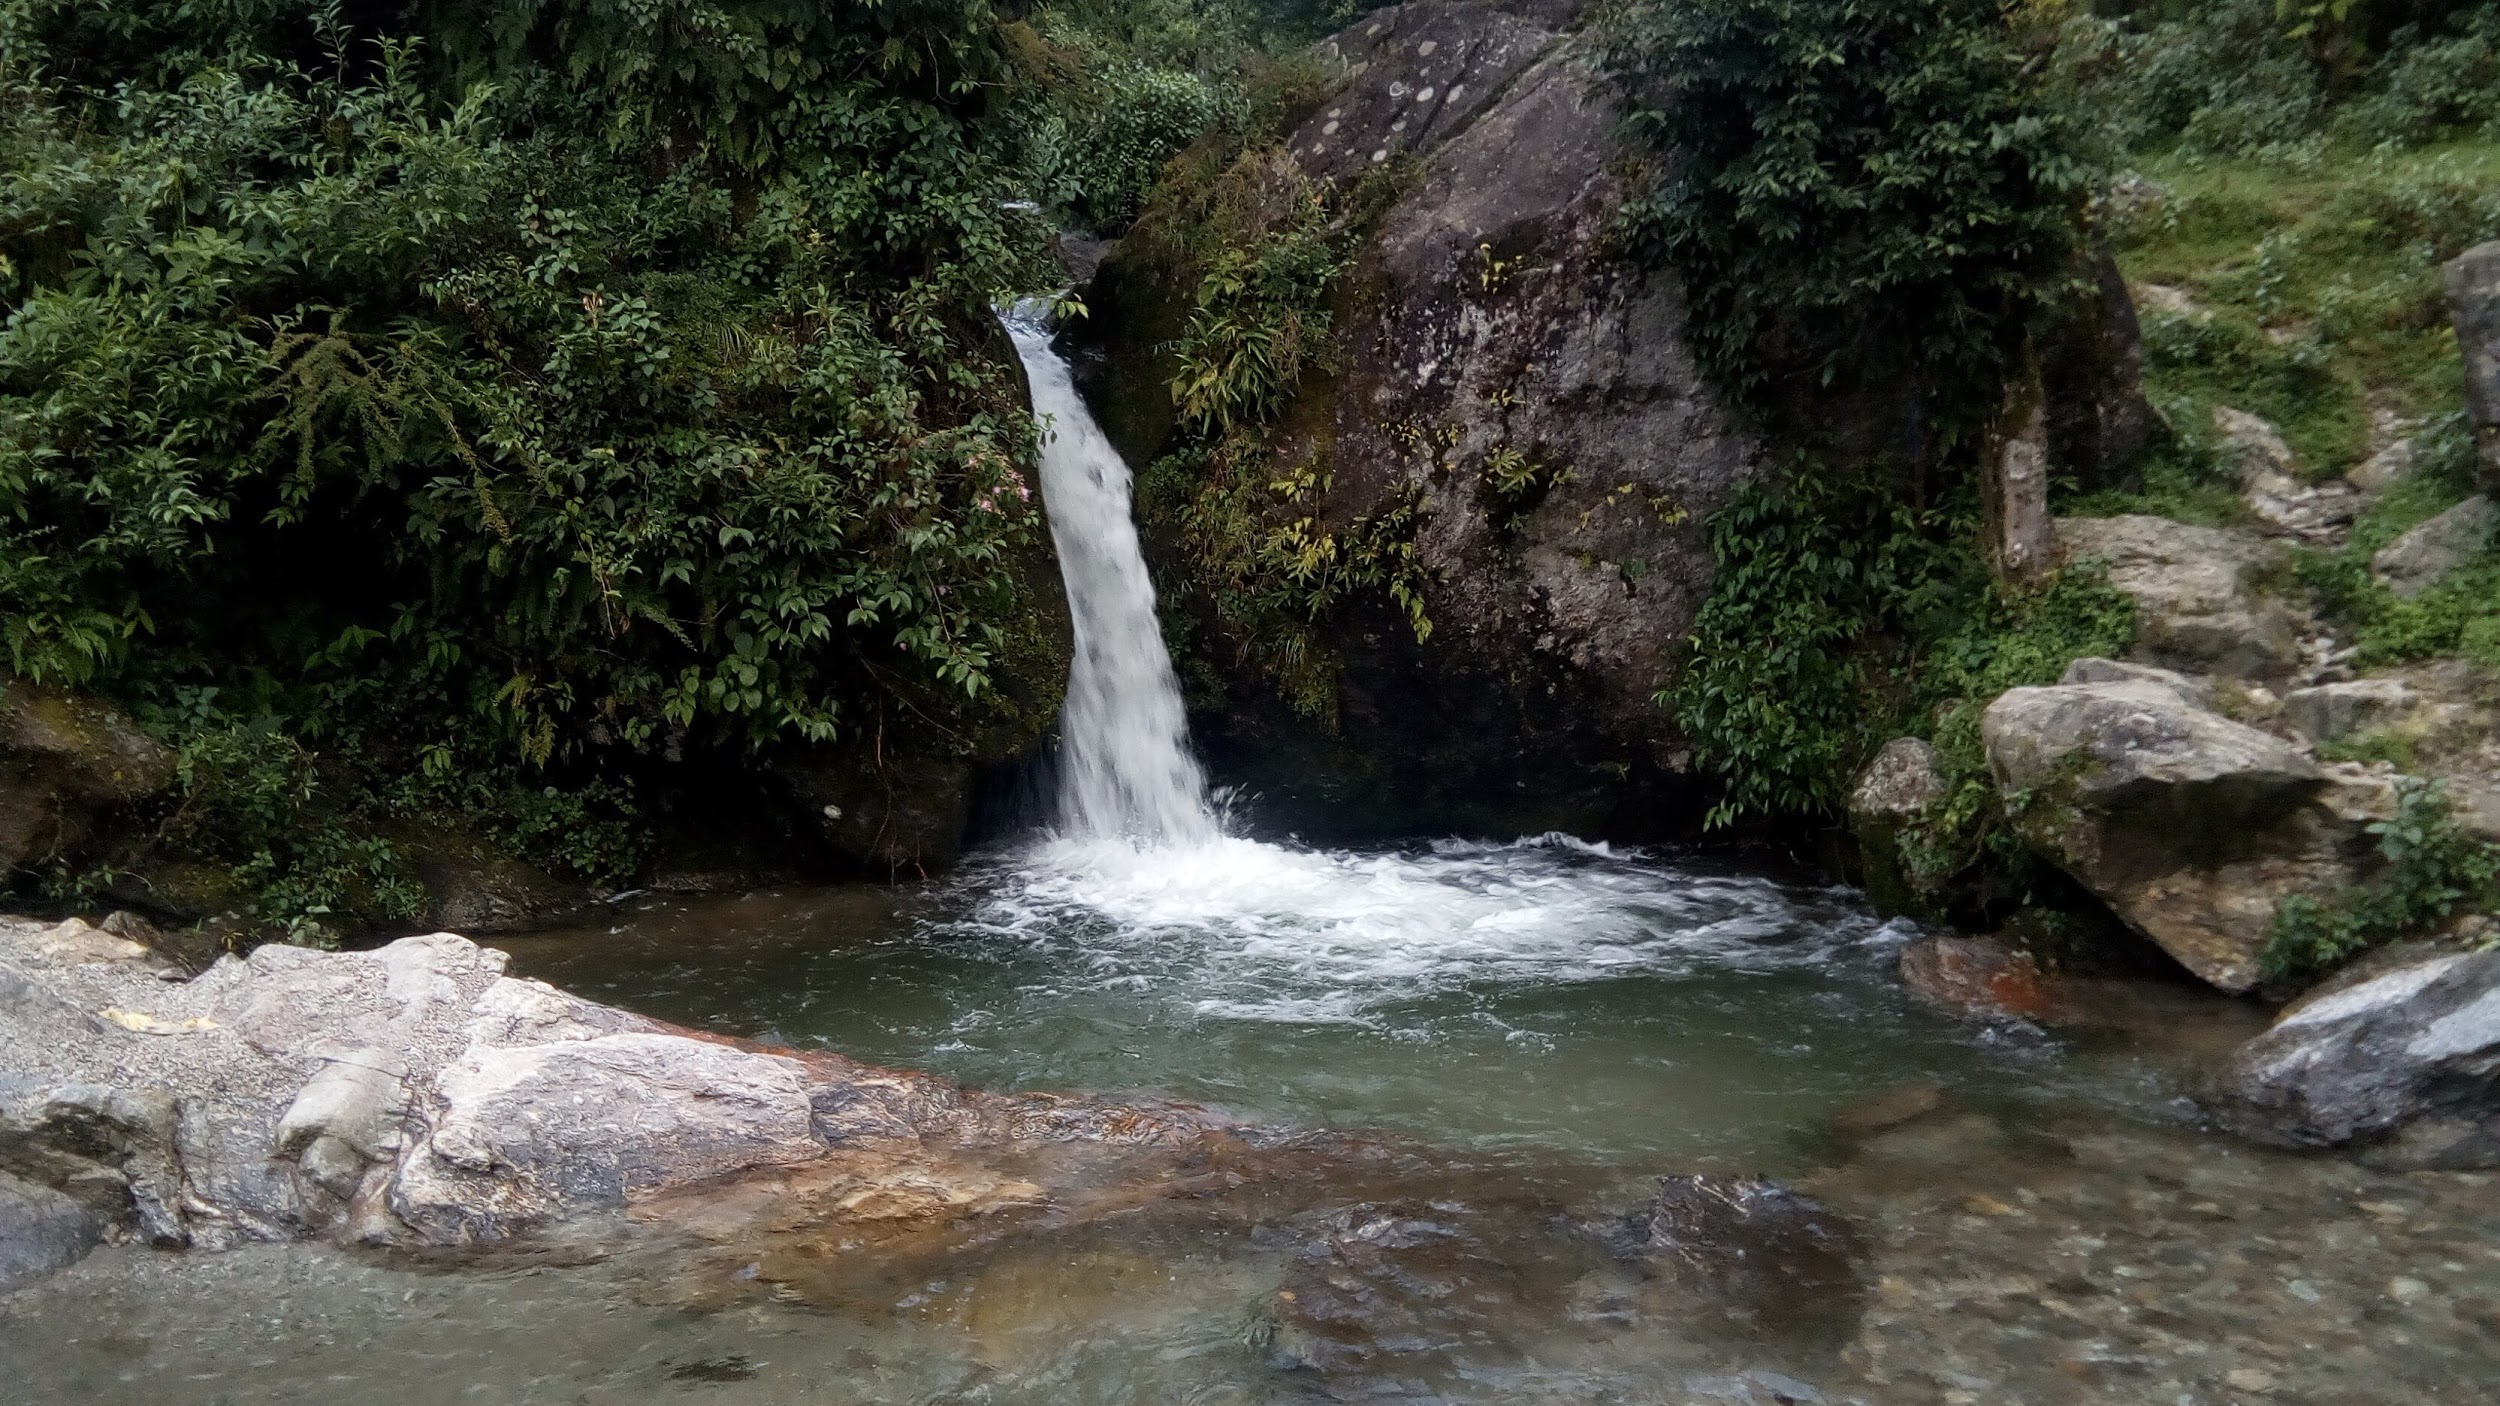
Stone spouts (known as dhungadhara by phonetically-spelling Nepali words in English, or as ढुङ्गे धारा for those who can read Nepali) serve as communal water sources for people living in the Kathmandu Valley. They are locations where the groundwater system naturally discharges into a spring or surface water body (e.g. underground water appears on the surface). Many of these have been developed and the discharge points have been channeled into these ‘stone spouts’ to aid in water collection and usage. People, especially the poor and underprivileged, come here to collect water for use in their homes, to do laundry, to bathe, etc.
As we’ve mentioned in a previous story, the population in the Kathmandu Valley has drastically increased over the last 50 years or so. This has put great stress on the water resources of the valley and is one of the reasons that we chose this location for our initial pilot project. For those who can afford to drill and operate wells, groundwater provides a consistent, reliable supply of water. However, as groundwater extractions in the valley increase, groundwater levels decline (we’re targeting groundwater level data collection as another component of our project). Consistent groundwater level decline can result in various negative impacts on both people and the environment.
Since we’re scientists and engineers (i.e. nerds, or enginerds, as some of us like to say), we like reading, because we actually think reading is fun and because we learn stuff by doing it. In case you feel similarly, there’s a great paper that was published by Charles Theis in 1940 that explains how pumping groundwater affects surface water (the USGS has a summary of it available here). Basically, all water discharged from a well represents a loss of water somewhere else. Typically this process starts as a loss of water storage in the underground aquifer that the well is tapped into. However, with sufficient pumping over time, that resulting loss of water can present itself as reduced flow in streams and rivers, or reduced flow at springs such as the stone spouts in the Kathmandu Valley. Reduced flow is our main concern at these stone spout locations, especially since they serve as the primary water source for many of the poor and underprivileged (i.e. those who don’t have access to water from a well or could not afford to pay for water pumped from a well should the stone spouts dry up).
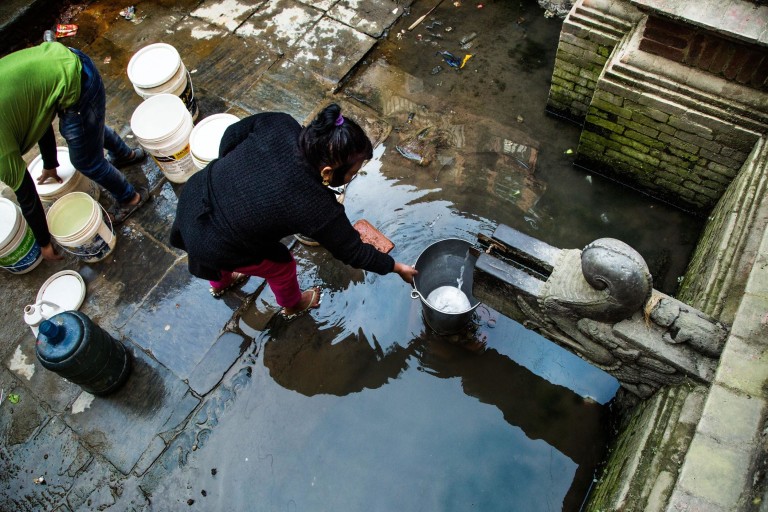
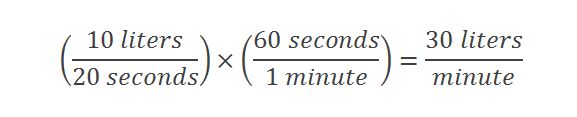
The flow measurement data collection the S4W staff completes at these stone spout locations is very simple, but also very effective. We utilize the same SmartPhone app that we use to record precipitation data (find out more about how it works here), but for this application we are measuring a volumetric flow rate. All that you need to record the flow rate at these locations is a bucket of known volume and a stop watch timer (a feature that basically all SmartPhones have). The bucket is held under the stone spout, the timer is started, and the time it takes to fill up the bucket is recorded, and voila, you’ve measured the flow rate. For example, if you have a ten liter bucket and it takes 20 seconds to fill up, the flow rate (as measured in liters per minute) would be:
We’ve included a photo of a staff member performing one of these measurements below, recording the volume of caught over a certain amount of time.
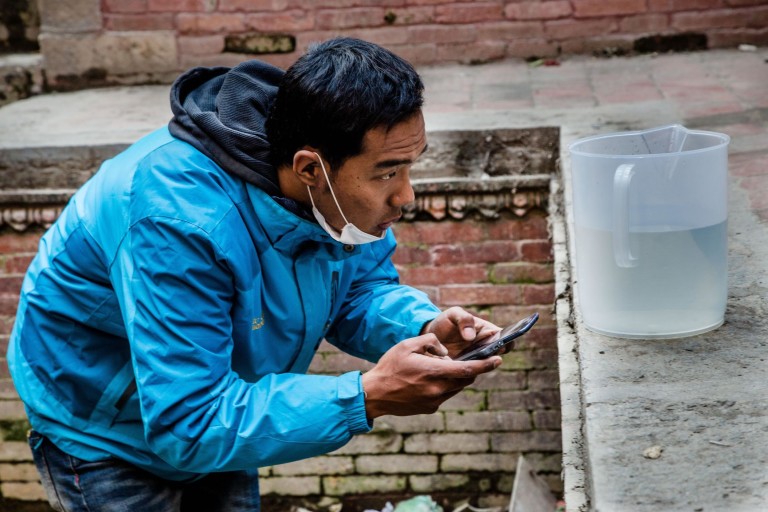
The data that we have already collected at stone spout locations helps define existing conditions, and continuing data collection will show any changes (once again, with the main concern being decreases in flow) that occur over time. These stone spout locations are critical communal water sources that especially the poor and underprivileged are dependent on; if they are affected, people in these communities may find themselves without access to water, one of the most basic needs that people have.
If you’re interested, you can read another article about the stone spouts in the Kathmandu Valley here.
Data Making a Difference – Flow Measurement at Stone Spouts Read More »
Meet Suraj Ghimire
Posted on July 12, 2017
This is our second story about one of our fantastic citizen scientists (you can read the first one here). Hope you enjoy meeting another important member of the team!
Q: What is your name? A: My name is Suraj Ghimire.
Q: How old are you? A: I’m 11 years old.
Q: Where were you born? A: I was born in Jhor, Kathmandu.
Q: Where do you live in the Kathmandu Valley? A: I live in Jhor, in the Kathmandu District, in the northern part of the Kathmandu Valley.
Q: Can you walk us through a typical day of life? What are the activities you’re doing? A: I go to school at 9:30 am and come back home around 4:00 pm. After school I do my homework, watch TV, and collect precipitation data for S4W-Nepal.
Q: Can you tell us a little bit about your family? A: I have a brother and sister; I am the youngest in my family.
Q: What is (or was) your favorite subject in school? A: English is my favorite subject, and I don’t like science at all.
Interviewer’s Note: While it was sad to hear Suraj say he doesn’t like science, we are glad he can still play an active role in S4W-Nepal. We are confident that he will warm up to science one day!
Q: Can you tell us about a favorite moments of yours? A: My favorite moment is whenever I ride my bicycle.
Q: How did you hear about the S4W-Nepal project? A: The S4W-Nepal team was in the area near our home, looking for willing citizen scientists to participate in the project. I was one of those willing citizen scientists!
Q: What has been your experience as a citizen scientist with S4W so far? A: I have enjoyed learning about something new! I am also receiving encouragement from the people around me as well; they are proud of me for getting a job.
Suraj is playing a critical role in S4W-Nepal as a citizen scientist. Each day, Suraj uses an Android application called Open Data Kit (ODK) to record rainfall collected by an inexpensive locally made rain gauge (each costs about $1.50). Suraj is the youngest citizen scientist participating in S4W-Nepal. He is motivated to participate in the project because of a desire to take care of the water resources he and his family rely on, and because each observation he makes earns him 25 rupees (roughly $0.25).
S4W-Nepal is a collaboration between S4W, Himalayan Bio-Diversity and Climate Change Center (HimBioCliCC), Kathmandu Institute of Applied Sciences (KIAS), Delft University of Technology, the Swedish International Development Agency, and Stockholm University. Water is our most precious resource. Lord Kelvin, a famous Scottish mathematician, once said, “you can’t manage a resource you don’t measure.” S4W-Nepal’s goal is to generate the data necessary to support wise water management decisions. S4W aims to accomplish this with a three pronged approach of Research, Education, and Employment. This project in the Kathmandu Valley is our first project.